Grade 11 CAPS > Climate and Weather > 3. Africa’s Weather and Climate > > 5. Reading and interpreting synoptic weather maps
A synoptic weather map is a weather chart reflecting the state of the atmosphere over a large area at a given moment.
Examples of synoptic charts can seen here.
Today’s Synoptic Chart

Today’s South African Weather Chart can be seen here.
GRADE 10 RECAP:
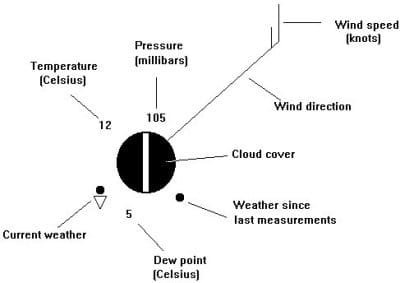
Weather elements: temperature, dew-point temperature, cloud cover, wind direction,wind speed and atmospheric pressure.
| Weather Element | Description | How it is measured | Unit of measure | Instrument |
|---|---|---|---|---|
| Temperature | How hot or cold it is | Thermometer | Degrees Celsius (°C) | |
| Precipitation | Moisture from the sky | Rain Gauge | Millimetres (mm.) | |
| Dew-point temperature | The temperature condensation will take place | Hygrometer. | Degrees Celsius (°C) | |
| Cloud cover | The amount of cloud in the sky | Observed by a meteorologist | Oktas - eighths of the sky | |
| Wind direction | Where the wind is blowing FROM | Wind Vane | Points of the compass (north, north-west etc), or bearing in degrees | |
| Wind speed | How fast the wind is blowing | Anemometer | Knots, or by the Beaufort Scale | |
| Atmospheric pressure | The "weight" of the air pushing on the surface of the Earth | Barometer | Hectopascals (although most people know it as millibars) |
Weather conditions: rain, drizzle, thunderstorms, hail and snow, as illustrated on station models.
Most reporting in the 21st century are electronic. Below is the weather for Sutherland in the Northern Cape; the coldest place in South Africa.


Reading and interpreting synoptic weather maps.
An example of a weather forecast
Synoptic Chart Lessons
Synoptic Weather Map Chart for Southern Africa 7 to 15 November 2019
A Lesson
Grade 10-12 Geography: Synoptic weather maps